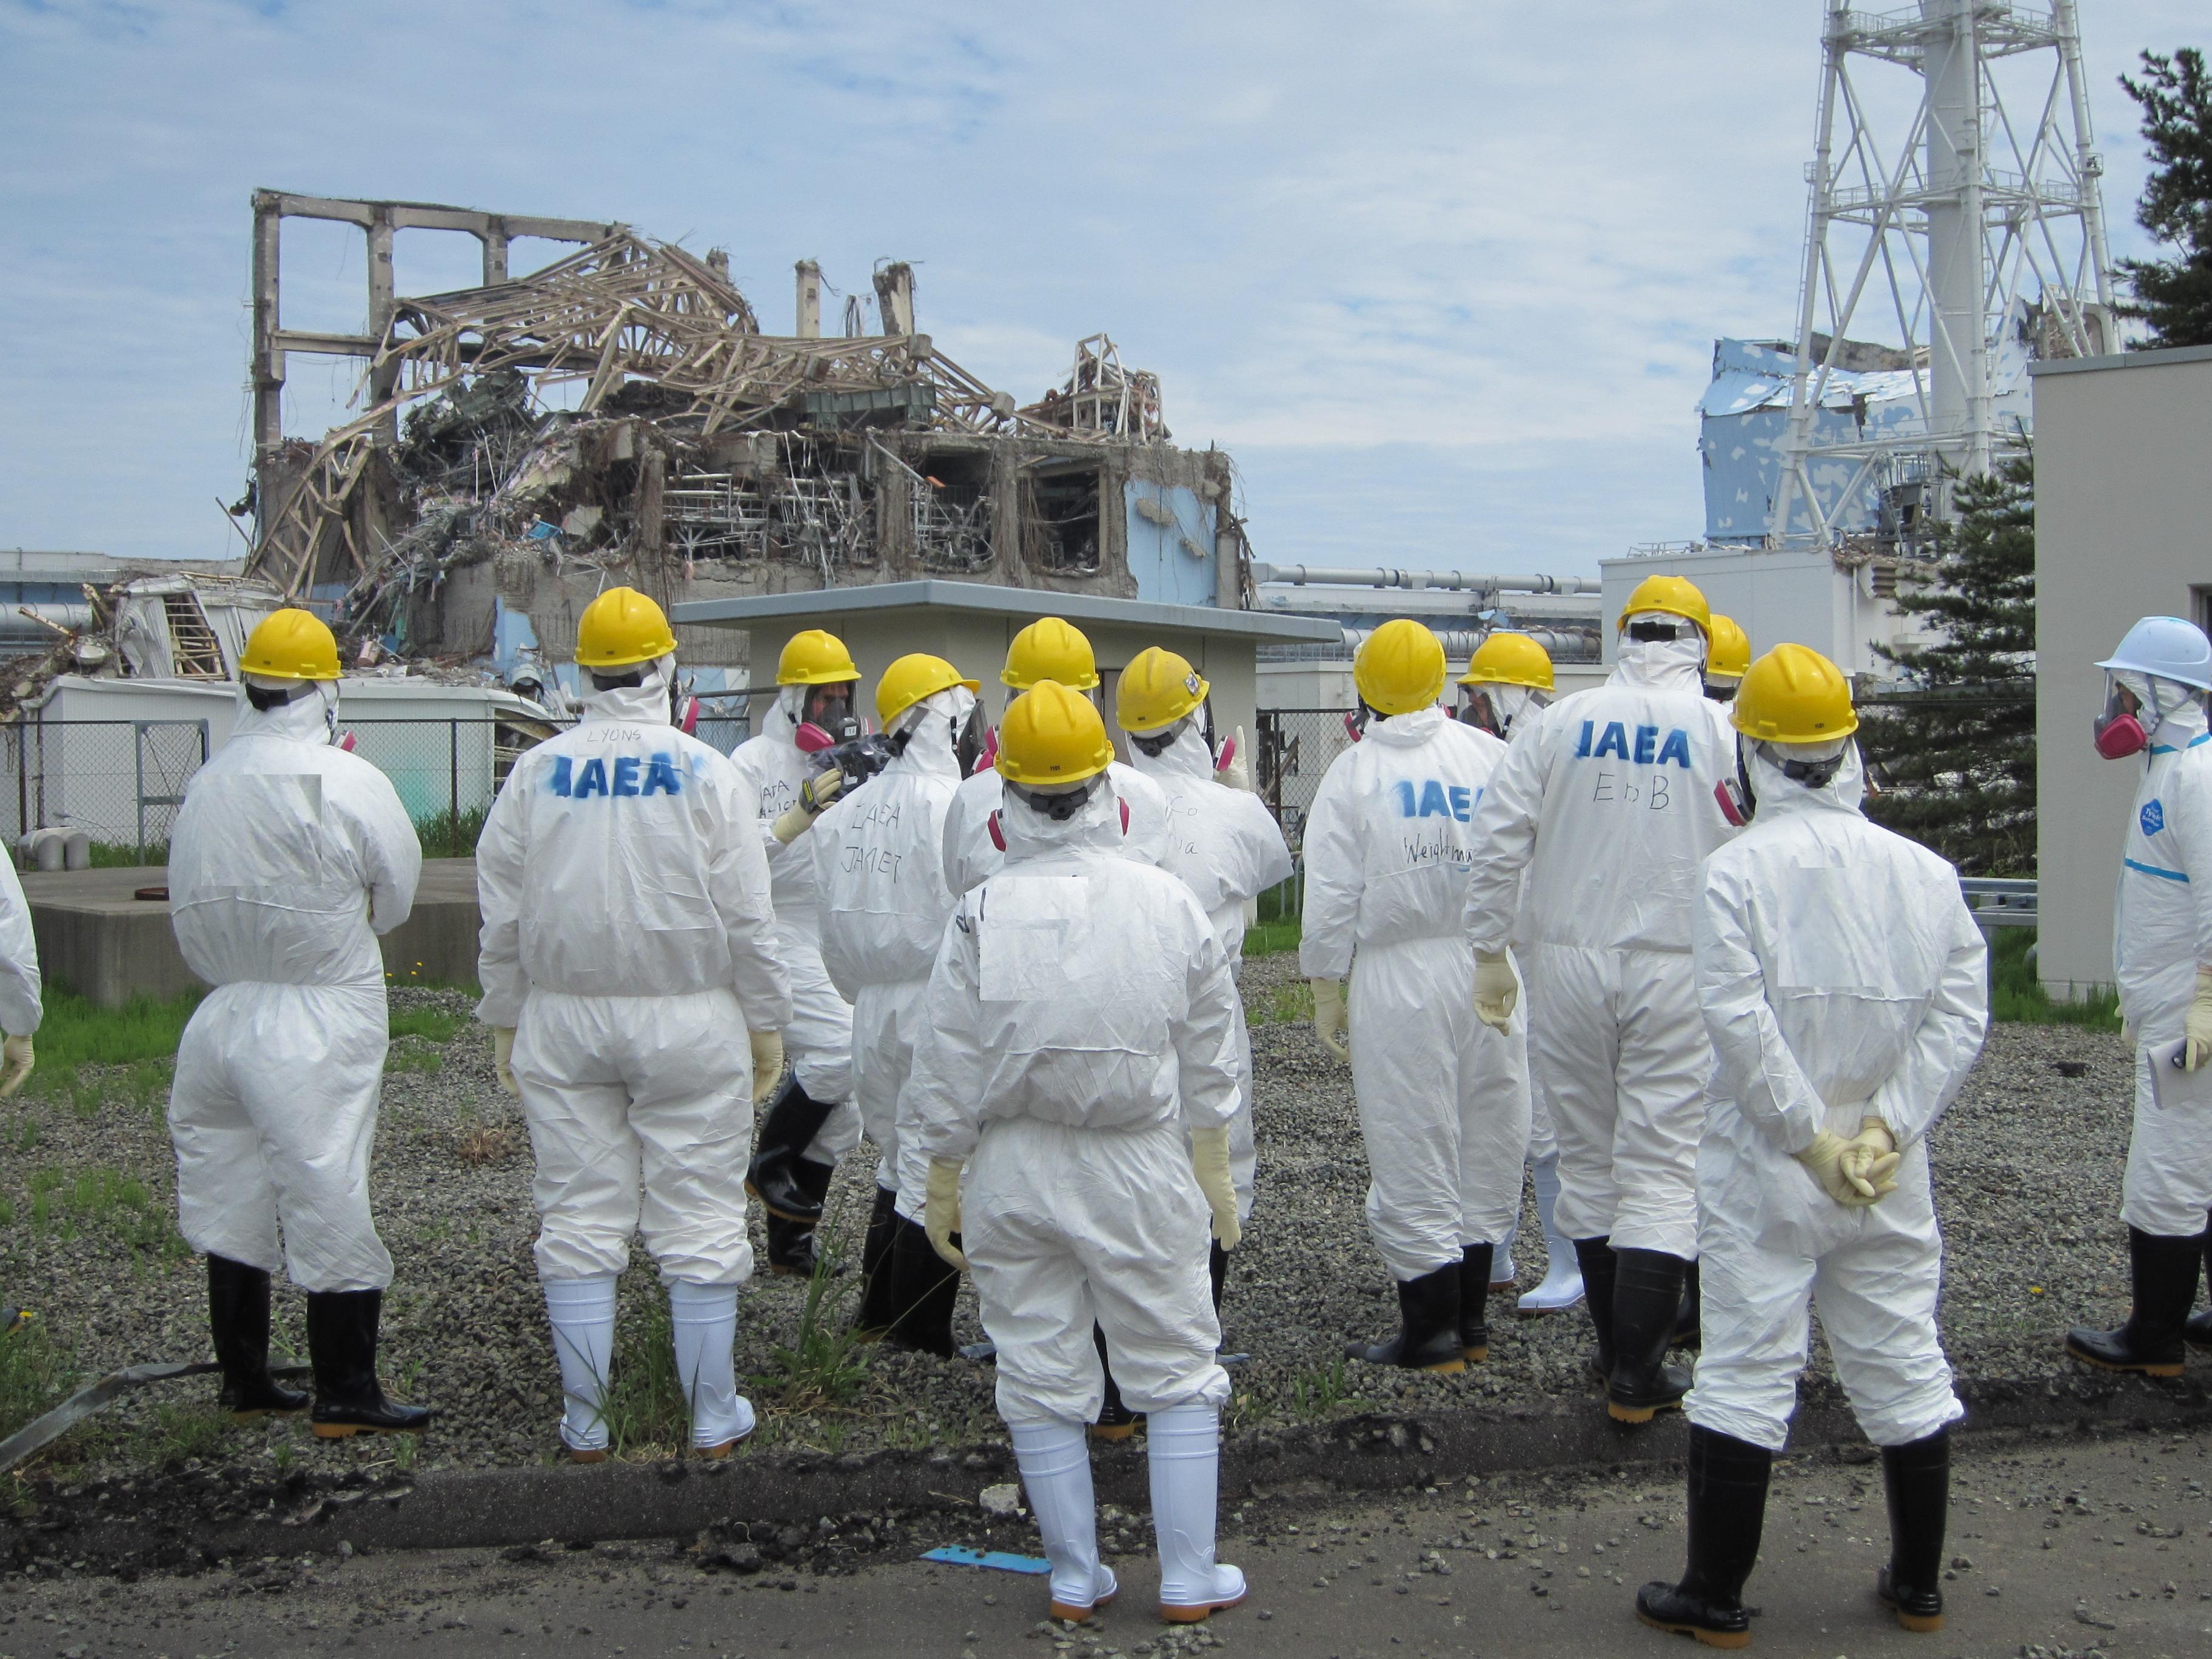
After the authorization of the Japanese government to release treated radioactive water from the Fukushima Daiichi nuclear power plant to the Pacific Ocean, images were released on social networks supposedly showing the impact of this release. However, they are taken out of context, since they correspond to other facts.
On Facebook or TikTok, accounts that share content related to news or socio-environmental issues have shown graphics that pretend to explain the extent of radiation from mares to other parts of the world. One of them is the one shown below:
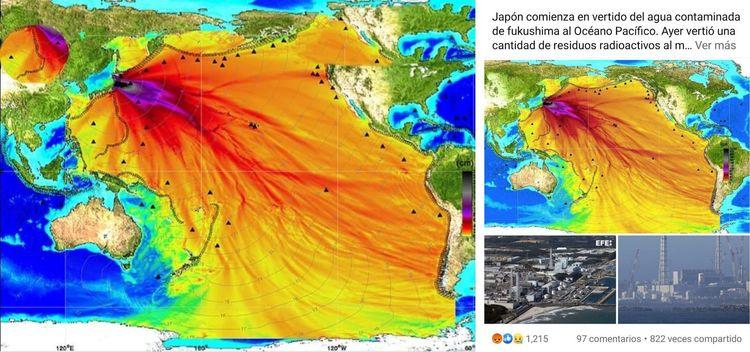
But this image, from the National Oceanic and Atmospheric Administration (NOAA), is from 2011 and does not show a trace of the impacts or radioactive discharges from Fukushima.
After the earthquake in Japan that year, which caused a tsunami with waves of up to 10 meters, NOAA created this graph to provide a forecast of the risks of sea elevations due to this natural phenomenon.
“The graphs show the forecast results, showing qualitative and quantitative information about the tsunami, including the interaction of the tsunami waves with the bathymetric features of the ocean floor and neighboring coasts. The amplitude information of the tsunami model is shown to be color-coded according to the scale bar,” explains NOAA in the publication.
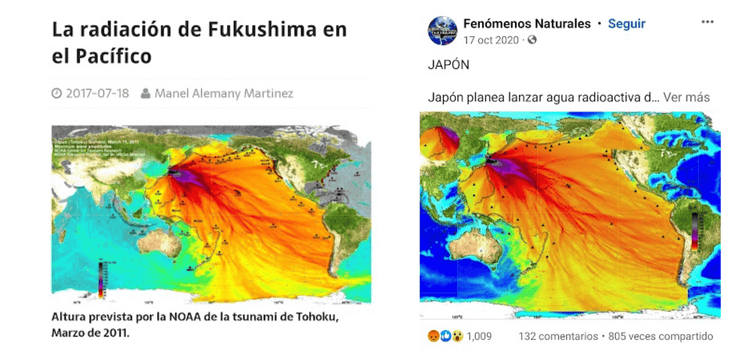
This is not the first time that such a graph has been used to misinform about alleged radioactivity in the Pacific. The image can be found on sites of notes or articles published since 2017 and later years:
A 2012 simulation
Another graphic that has been released to illustrate what could be the expansion of the radioactivity of Fukushima waters is the following:
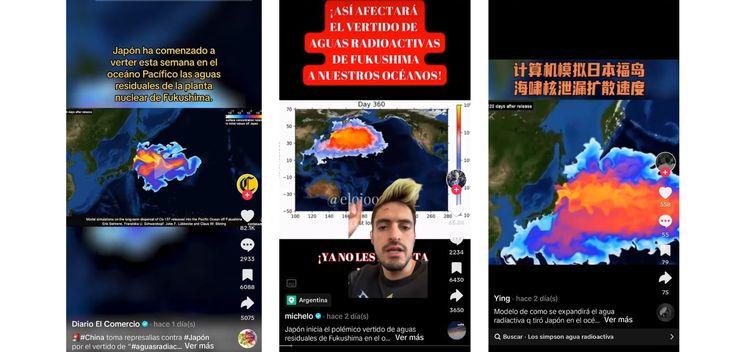
In this case, the graphic is also taken out of context, since it is a simulation published in the scientific journal Environmental Research in 2012 about the possible dispersion of cesium (a chemical element considered to be highly radioactive) following the damage to the Fukushima power plant due to the 2011 tsunami.
Although the model is based on seawater samples collected at nuclear power plants by the Tokyo Electric Power Company (TEPCO) and the Japanese Ministry of Technology (MEXT) in the weeks following the tsunami, it does not represent the radioactivity of the waters that will be released in Japan.
“The spread and dilution in the Pacific Ocean was simulated for 10 years. The simulations do not include any assimilation of data and, therefore, do not take into account the real state of local ocean currents during the release of highly contaminated water from damaged plants in March - April 2011,” notes the 2012 publication in the journal Environmental Research.
So the map could be a background, but not the presentation of future impacts.
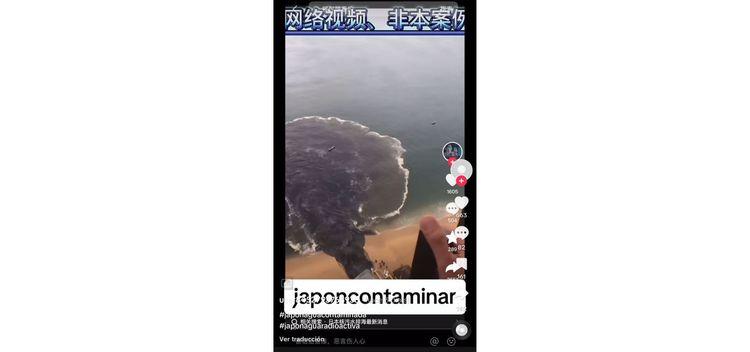
In addition, a video has been circulated on TikTok that they say is evidence of wastewater discharges, but it is really a waste discharge from 2020 on Icacos beach, in Acapulco, Guerrero, in southern Mexico.
With regard to measuring the impacts of radioactive water discharges, until press time of publication of this note, there are no current graphics that can illustrate what types of impacts to the oceans this decision will bring.
TEPCO and the Japanese government have asked citizens to trust science. After the announcement on August 24 about the start of the discharges, the company said in a press release that industrial water was previously tested and that the discharge was carried out with the utmost vigilance. Adding that in the event of any anomaly, the activity will stop.
However, verifying whether this plan will be effective will depend on the progress reported over time and the future studies that are carried out.
*This content was produced with the support of the Institute for War And Peace Reporting and mentoring from Animal Político, within the framework of the Mexican Journalism Resiliency program.

Comentarios (0)