
Geographic information in the hands of the public administration is extremely heterogeneous in terms of objectives, technological formats, volume of data, disaggregation and cartographic accuracy, associated methodological information, updating periods, allocated budget, and even certainty and quality of data and, of course, public availability and in open formats, among many other characteristics. To standardize these characteristics as far as possible, there are robust legal frameworks such as the National Statistical and Geographic Information System Act, or the general and federal laws on transparency and access to public information, however, the path taken in this regard is still incipient. Currently, the exception is those cases in which administrative geographical information is public, open, structured, timely, comprehensive, free, and with a strong commitment to maintaining the best technical standards.
The lack of transparency in public information affects the State as a whole, it is not only civil society that suffers from opacity, but the authority itself is a predominant subject in the suffering of this practice. The lack of coordination between public policies and information transparency can lead to contradictory policies. This reality is equally true for geographical information owned by the government, so for example, a forest territory that has received payments for environmental services for its conservation can also be granted to mining by the same government that granted public resources for conservation, without even being aware of the absurdity committed. Examples such as the one above are not hard to find, including databases that are out of date, incomplete, with errors, or within obsolete computer systems that current officials do not have full control over.
An initial path to advance this agenda is the one followed by the Natural Resources Transparency Index (ITRN), a transparency initiative on the public management of water, forests and fisheries, promoted by four civil society organizations 1 within the framework of the Fourth Plan of Action of the Open Government Alliance. Among the components that make up this index, a section was dedicated to the evaluation of the transparency of geographical information corresponding to the areas of the characterization and zoning of these natural resources, to permits and concessions for extraction and exploitation, to subsidies, and to inspection and surveillance. In total, 98 disaggregated geographical indicators were evaluated as follows:
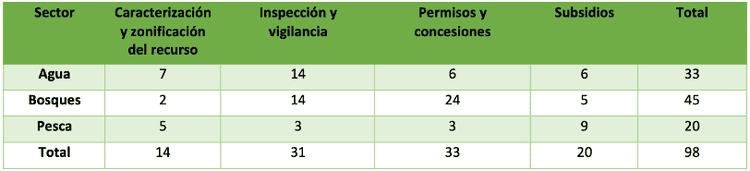
Table 1. Categories of geographical indicators evaluated in the ITRN
For the Transparency Index, each of these 98 geographical indicators was evaluated according to whether or not they met the expected geometry and, in turn, whether or not the available data were in open and reusable formats. The expected geometry was determined for each indicator considering what would be the appropriate geometry in which the geographical feature (point, line or polygon) should be expressed as appropriate, so for example an inspection site could be expressed as a point, a stream of water as a line, and a closed area as a polygon. The overall result of the evaluation was extremely low, on a scale of 0 to 1 (from lowest to highest transparency), geographical information on water sector management was the best evaluated with 0.45, followed by the fishing sector with 0.36 and finally the forestry sector with 0.15.
From the results of this component of the index, it appears that official geographical information with respect to the area of characterization and zoning of resources is generally the most complete, forest resources are very well identified, as are water resources, not fishing resources, which are lagging far behind. The geographical information corresponding to subsidies is generally in second place in terms of transparency, in this case subsidies from the fishing sector are the best identified. On the other hand, the geographical information corresponding to permits and concessions is extremely poor for the forestry and fishing sector, and the water sector has greater transparency, although with significant deficiencies. Finally, inspection and surveillance is the area with the greatest opacity in all three sectors. The table with the main results can be seen below:
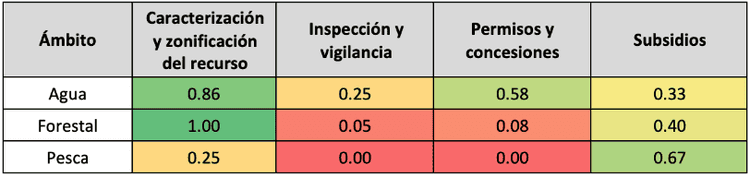
Table 2. Main results of the ITRN's Geographic Information Assessment
The index's findings in terms of geography indicate a large gap in the available information. On the one hand, the physical characterization of the resources has good cartographic coverage, as well as the subsidies, which are commonly subject to public scrutiny and present some geographical information. But on the other hand, the administrative cartography that identifies inspection and surveillance efforts, as well as the granting of exploitation permits and concessions, presents the biggest lags in information generation and transparency.
These are precisely the areas where it is necessary to influence the corresponding authorities to generate and know a comprehensive cartography of resources, which allows society as a whole to have better control, use, distribution and conservation of the natural environment. The physical information of the territory is increasingly complete, and in many cases the information derived from the processing and analysis of satellite images is updated almost in real time. But it is the acts of authority, the geographical information that regulates the territory and that is contained in the documents containing the logs, authorizations, permits, decrees, contracts and concessions that remain on the map, everything that regulates the territory and that is not perceptible from a satellite, at least until it is too late.
Note:
1 CartoCrítica, Causa Natura, Fund for Environmental Communication and Education and Reforestation Mexico

Comentarios (0)